

Monitoring · Air Quality
Where is the air bad, and since when?
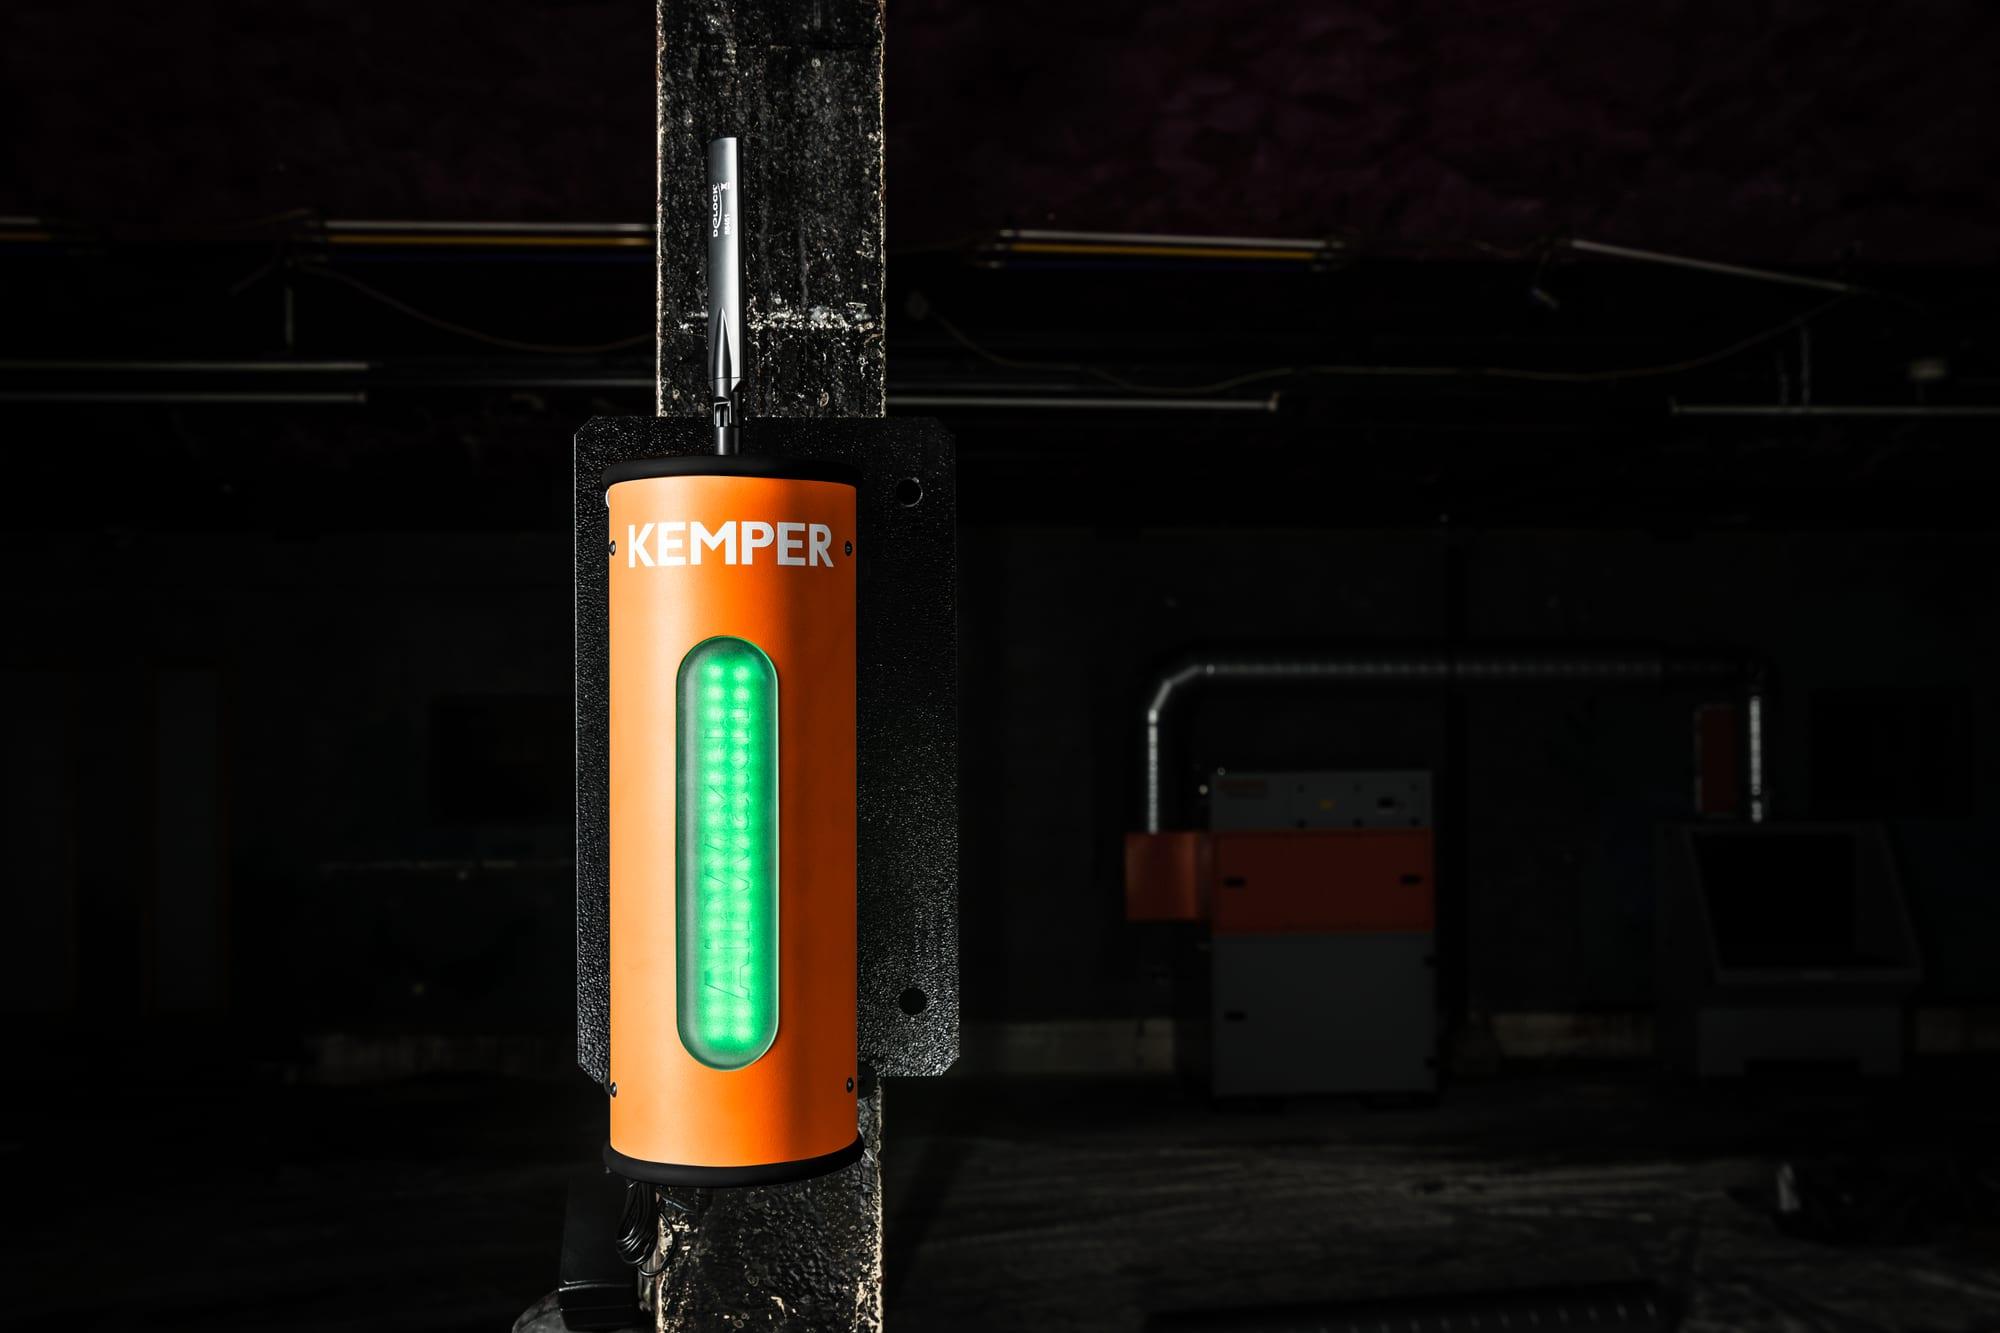
AirWatch sensors measure welding fumes and particulate matter in the hall air. KEMPER Connect rates the values as a traffic light in five levels, shows the polluted areas in a ranking, and documents the history, on request only for shift hours.
Rating
Five levels instead of raw numbers
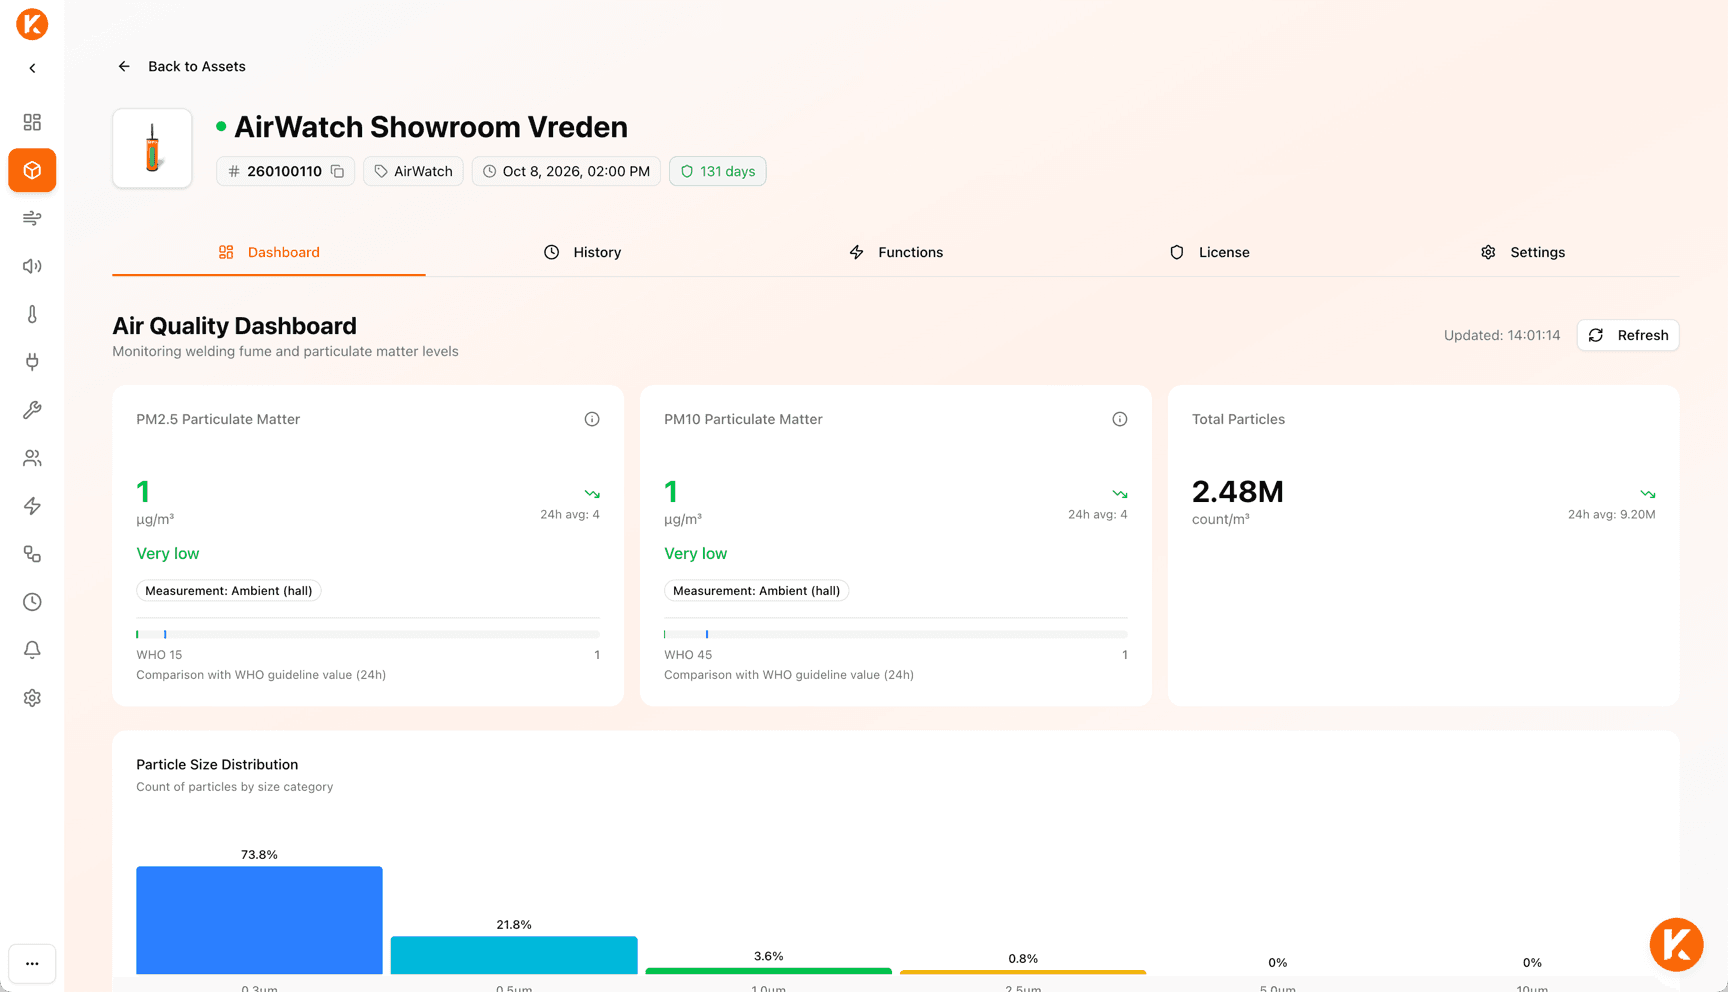
Current particulate matter values PM2.5 and PM10 are color-rated: Very good, Elevated, High pollution, Very high pollution, Extreme. The levels are tailored to indoor air; KEMPER derived them from the measurement data of more than 300 AirWatch units in the field. A trend arrow shows the development against the 24-hour average.
The comparison with the WHO 24-hour guideline value appears as a bar with a marker, including a note that industrial environments are typically above it. In addition there are the total particle count with trend and the particle size distribution in six size classes from above 0.3 µm to above 10 µm.
Background
Where the five levels come from
Why does KEMPER Connect not simply rate the hall air against the legal limit value for welding fumes? Because that limit value is measured at a different place than the indoor air.
The limit value applies at the welding point
In Germany, the legal limit value for welding fumes is 1.25 mg/m³ (1,250 µg/m³) for respirable dust and 10 mg/m³ for inhalable dust. It is measured directly at the welder, at the source of the fumes. Other countries have their own limit values; there too, measurement is usually taken at the welder.
The AirWatch measures the indoor air
An AirWatch hangs on a pillar or on the wall, not at the welding point. Just one meter away, the hall air dilutes the fumes so much that the legal limit value is practically never reached there. As a benchmark, the traffic light would always be green, even when the air at the welding station is bad.
Automation needs reachable thresholds
The Rule Engine switches units on and off at certain readings and controls the volume flow of the AirDome. With the legal limit value as the threshold, it would never react in the indoor air.
Five bands from field data
KEMPER analyzed the measurement data of more than 300 AirWatch units in the field over several years and derived the five levels from Very good to Extreme. They describe how polluted hall air is in practice and are the basis for controlling extraction and ventilation units as needed.
Automation
From the reading straight to extraction
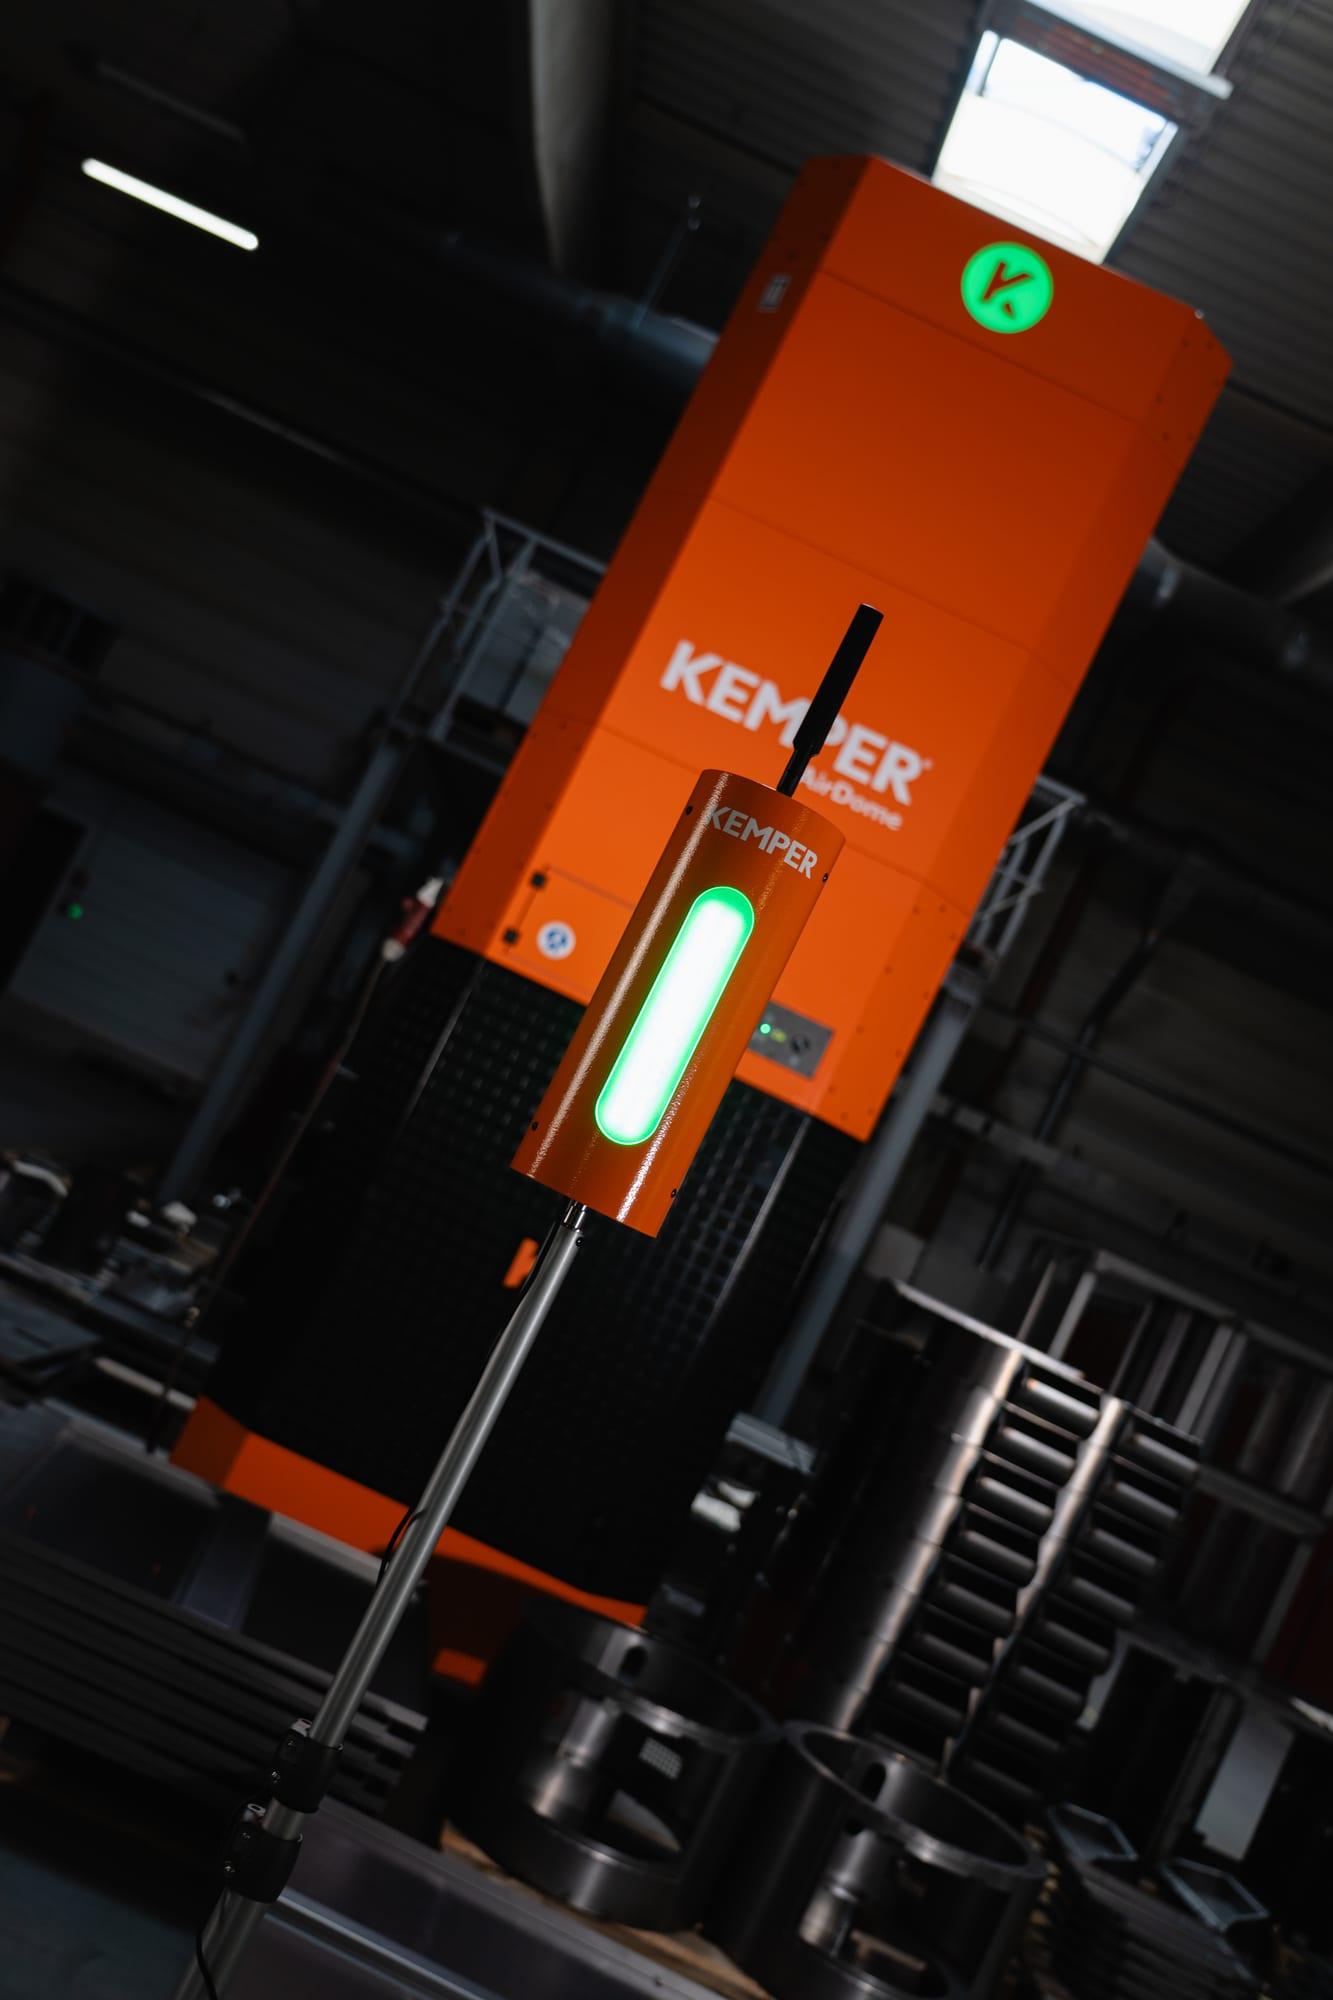
The same AirWatch that documents the air quality controls the extraction via the Rule Engine. When particulate matter rises, the units ramp up; when the air is clean again, they ramp down. The Rule Engine controls the AirDome continuously and switches the other units on and off; for new CleanAirTower units, continuous control via the volume flow is in preparation.
- Several sensors, one rule: By default the worst AirWatch counts, so that a single smoky workstation is not averaged away.
- Time windows: Base extraction in the early shift, quiet hours at night, a fixed value during maintenance.
- Safety: If all sensors fail, the units run at full power, never off.
- Email notification: If an AirWatch exceeds the PM10 threshold, selected recipients receive an email.
Site page
All AirWatch units on a site on four tabs
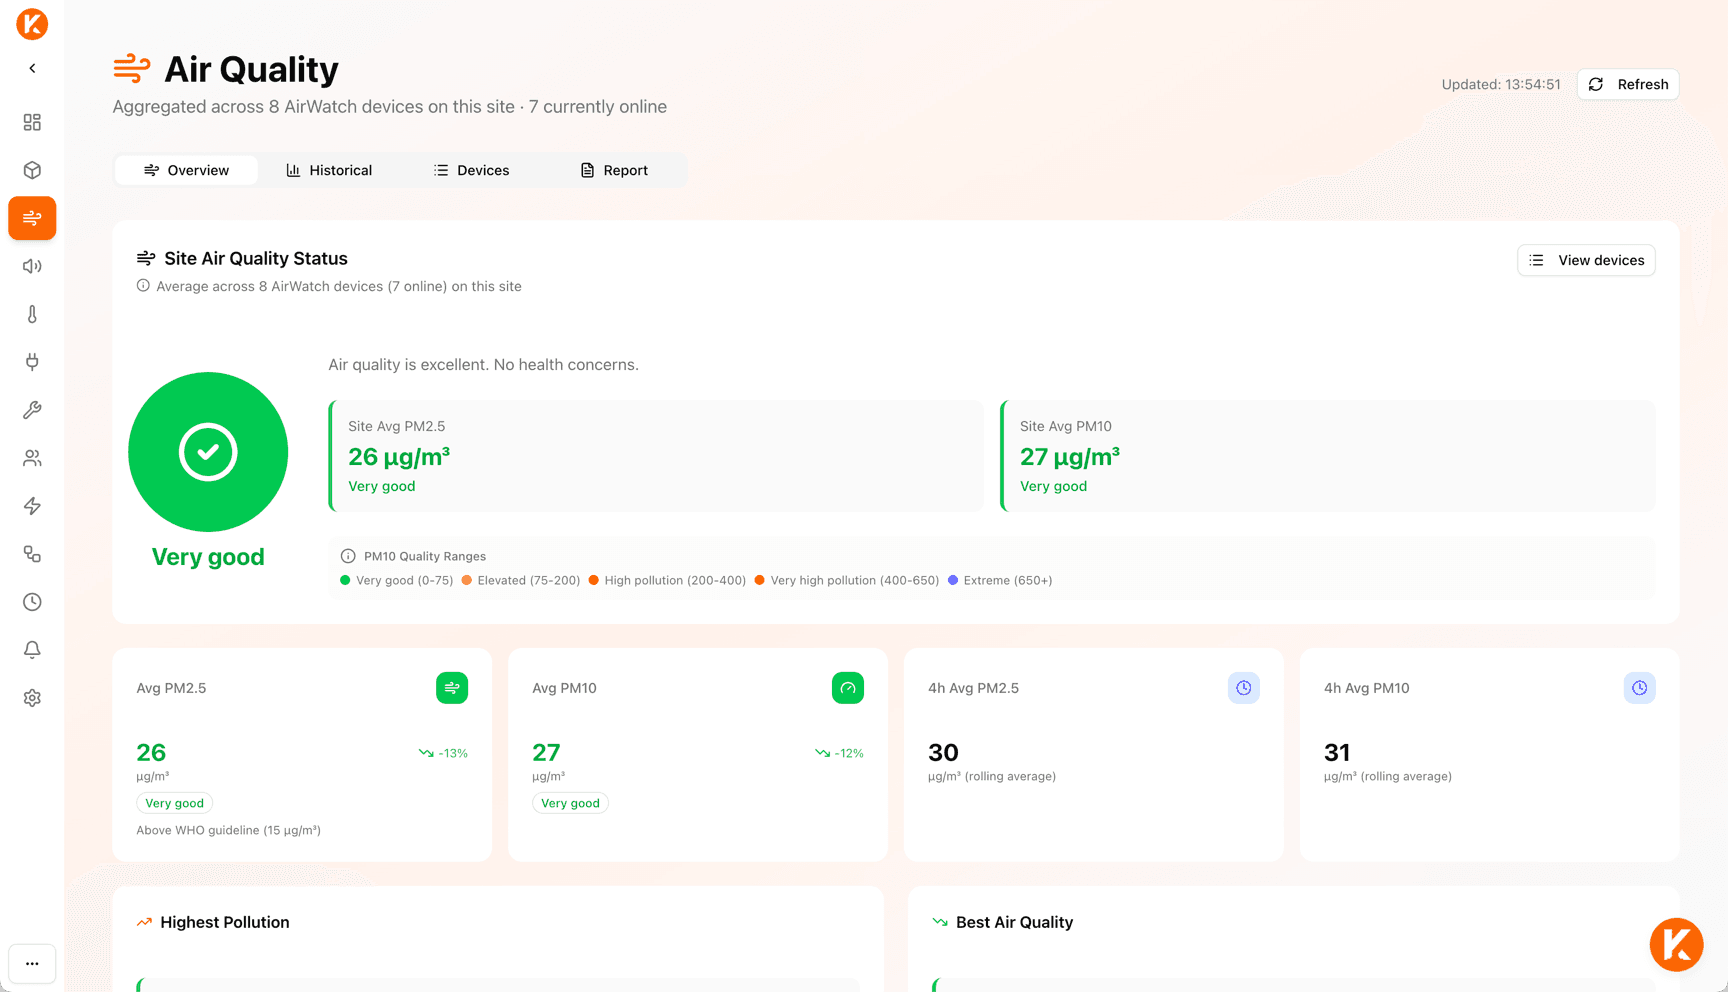
Overview: overall status of the site as a traffic light for PM2.5 and PM10, site averages, 4-hour rolling averages, WHO reference, and the rankings “Highest Pollution” and “Best Air Quality” with a direct link to the device.
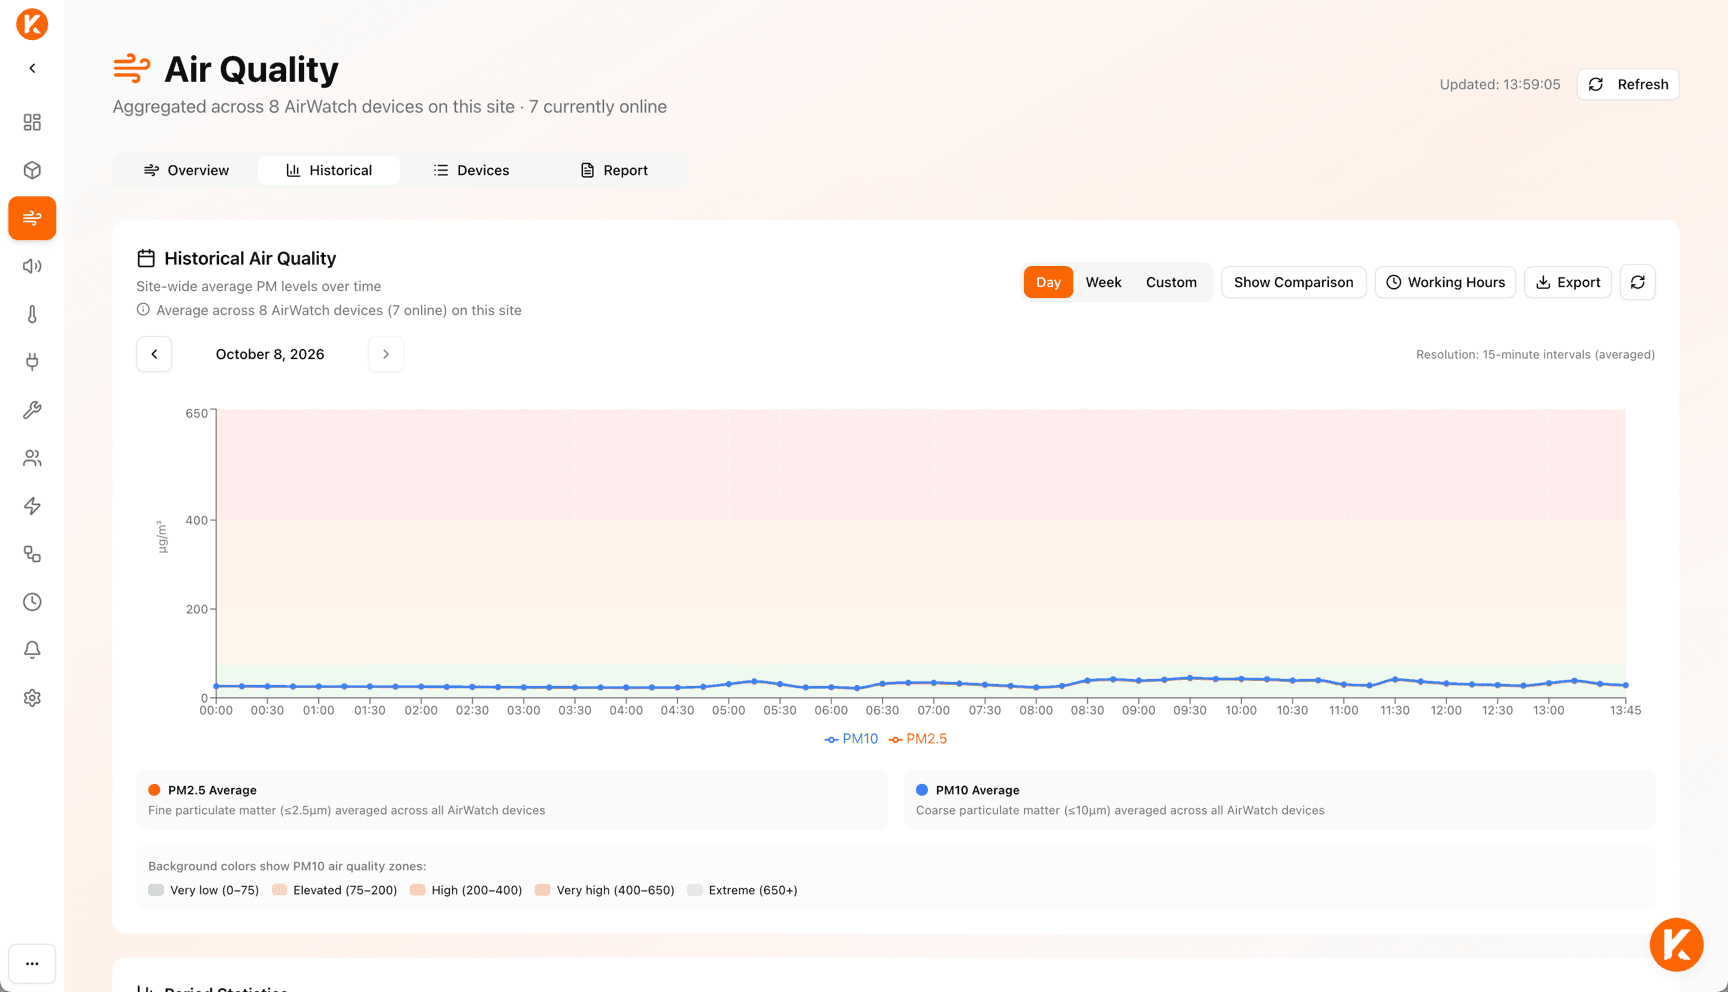
History: site-wide history over day, week, or a freely chosen period with colored pollution zones, comparison with the previous period, working hours filter, statistics, time distribution, and CSV/Excel export. Devices: table of all AirWatch units with PM2.5, PM10, 4-hour average, location description, and status, dustiest sensor first by default. Report: print-ready PDF report for the whole site.
- 4-hour rolling averages matter because some regulations call for rolling averages instead of instantaneous values.
History and statistics
Compare, filter, distribute
Periods of day, week, month, or freely selectable, with paging through past periods. The comparison with the previous period shows yesterday, the previous week, or the previous month as a dashed line and the change in percent (“Increased by 12 % from 38 to 43 µg/m³”).
The working hours filter restricts the statistics to shift hours (default 06:00 to 16:00, weekends excluded), so that the empty hall on the weekend does not enter the rating. For each pollutant there are average, minimum, maximum, and median. The time distribution shows what percentage of the time the air was in which pollution level, with the duration in hours and minutes.
Share
Export and report
PDF report
For the whole site or a single AirWatch: day or week, cover page with executive summary, full-page chart with pollution zones, statistics, exceedances, peak events, methodology.
CSV or Excel export
Optionally with statistics block, time distribution, comparison period, and working hours filter, resolution from 5 minutes to 1 day.
Scope
The five levels and the WHO guideline value are rating bases for indoor air, not legal limit values that the platform proves compliance with. The AirWatch measurements are ambient measurements in the hall air, not personal exposure measurements and not measurements against an occupational exposure limit.
The device dashboard works with the 24-hour average, the site page with 4-hour rolling averages.
Terms explained briefly
- PM10
- Particulate matter with a particle diameter of up to 10 micrometers, given in µg/m³ (micrograms per cubic meter of air).
- PM2.5
- Particulate matter with a particle diameter of up to 2.5 micrometers. Smaller particles that reach deeper into the airways.
- WHO 24-hour guideline value
- Guideline value of the World Health Organization for particulate matter exposure as a daily average. Serves as a benchmark for comparison.
- Respirable dust (A-dust)
- Fine dust fraction that reaches the alveoli in the lungs. In German regulations called A-Staub.
- Inhalable dust (E-dust)
- Total dust fraction that can be inhaled through mouth and nose; includes the respirable fraction. In German regulations called E-Staub.
- Ambient measurement
- Measurement of the hall air at a fixed location in the room, as opposed to measurement directly at the welder.
- 4-hour rolling average
- Average of the last four hours that moves forward with every new reading. Smooths short peaks.
- Time distribution
- Share of time in percent and duration during which the air was in a particular pollution level.